-min.webp&w=3840&q=75)
Returns are basically the gains earned by an investor on his investment. They are generally depicted in the percentage form. The return on investment portrays how well our investment is performing over a period of time.
Well, the return on an investment can be either positive or negative. For example, your investment of Rs 1 lakh may yield Rs. 1.1 lakh in a year accruing 10% gain. And over the span of next year, your investment could also incur a loss of 20% to bring down your capital to Rs 88,000. (total loss of 12%, if you could notice). Why does this happen?
This is because the value of the asset on which you invest depends on the market sentiments. Moreover, the world of investment has devised numerous ways to determine the performance or calculate the returns on an investment. The diversified points of view may confuse you in deciding which of your investment is doing its best. Never mind, this blog will probably help you make a rational comparison of your investment options according to their respective returns.
If you go through the different types of financial literatures such as investment blogs, scheme information documents, financial research websites, etc., you’ll be able to point out several ‘Return’ terms. Let us try to figure out what each of those terms meant.
Absolute Return or Point to Point Return:
Absolute return is the capital gain that an investment portfolio achieves over a period of time. It is a measure of growth of an asset in terms of percentage of invested capital. The calculation of absolute return considers the NAV of the fund on the two dates – the beginning and the end of the holding period. This method is generally used to track the performance of an asset from one point of time to another. So the formula becomes –
{(NAVend - NAVstart)/ NAVstart}X 100
Let us comprehend it with the help of a simple example. Suppose, you invest Rs. 1000 in a mutual fund scheme and the value of this investment grew to Rs. 1300 after 3 years. Let us establish how the absolute return is calculated then,
Initial NAV = Rs. 1000
NAV after 3 years = Rs. 1300
Total profit = NAVend - NAVstart
= 1300 – 1000
= Rs. 300
Absolute Return = (300/1000) * 100
= 30%
As you can see, the time period over which your investment achieves growth is not at all an influencing factor. In case the investment of Rs. 1000 grew to Rs. 1300 in 5 years (instead of 3); the absolute return will nevertheless be 30%.
Total Return
The total return is the sum of capital gains and dividend over any given period of time. It is divided by the original amount of investment to be expressed as percentage, which is a measure of its performance. Total return can be considered as a specific case of Absolute Return, as it involves all the types of income gained by an investment. Let us bring in some assumptions and take an example for our understanding.
Let,
Amount invested = Rs. 1 lakh
Initial NAV of the fund = Rs. 20
So,
Number of units purchased = Amount invested /NAV
= 1 lakh/20
= 5000 units
NAV of the fund after 1 year = Rs. 22
Now, value of the units = New NAV * Number of units
= 22*5000
= Rs. 1.1 Lakhs
According to the above calculation,
Capital gain on the investment = Rs. 1.1 Lakhs – Rs. 1 Lakh
= Rs. 10,000
Let us now assume that the scheme decides Rs. 2 per unit as dividend during this year.
So, the total dividend = 2*5000
= Rs. 10,000
As we have discussed,
The total return on investment = capital gains + dividends
= 10,000 + 10,000
= Rs. 20,000
Total return in terms of % = (Total gain/Amount invested)*100
= (20000/ 1 Lakh)*100
= 20%
Let us now make a different assumption where we want to know the total return for the duration of 1 month. Keeping the initial NAV of the fund, amount of investment and number of units unchanged, assume that the NAV of the fund grows to Rs. 25 after a month. Consequently, the value of the holding units after 1 month will become Rs 125000 (25 * 5000) and the accrued capital gain will be Rs. 25000. Now let us assume that the scheme declared Rs. 1 per unit as dividend for this month. Including the total dividend (1 * 5000 = Rs 5000), the total return on investment is 30% of the investment (Rs 30,000). The total return can be calculated for any period of time by summing up the capital gains and dividends for that period.
Average Annual Return (AAR):
The average annual return (AAR) is the average of the historical returns of a scheme or asset. Inherently, it is the arithmetic mean of a series of annual rates of returns. AAR can be mathematically expressed as percentage by the following formula -
AAR = (Return in period 1 + Return in period 2 + Return in period 3 + …. +Return in period N)/ Number of Period or N
Let us consider an illustration. Suppose you invest an amount of Rs. 10,000 in a fund for a period of 5 years from 2006-2010. For the same period, the company documented the annual returns in the following manner:
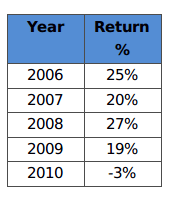
AAR for the period from 2006 to 2010 = (25% + 20% + 27% + 19% - 3%)/5 = 17.6%
As you can see, the outliers (high and low) can skew the average return. This average can be misleading, if you consider the historical information while making your investment decisions.
Compound Annualized Return (CAGR Approach):
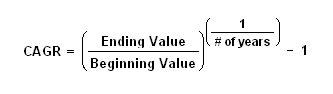
As the name suggests, it is the annualized return that takes up the compounded growth of an investment for a given period of time. Compounding is simply, profits made on profits. Calculation of compound annualized returns portrays the effect of compounding on your investment. To calculate it, we use Compound Annualized Growth Rate formula (CAGR). Let us try to understand this fuzzy concept that uses the below formula for return generation.
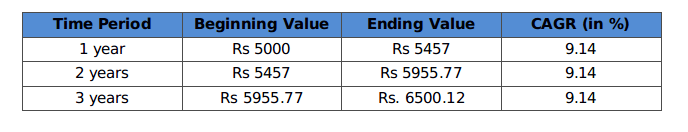
For example, you invest Rs 5000 in a mutual fund scheme, and the value of this investment becomes Rs 6500 after 3 years. CAGR will calculate the returns generated by the investment in each year, for 3 years considering that they were re-invested every year. This implies that annualized returns will be 9.14% for 3 years cumulatively. Refer to the table below to see how the calculation leads to the derivation of 9.14% as the growth rate.
CAGR3 year = ((6500/5000) ^ (1/3)) - 1
= 9.14%
Notice that compounded annualized return of 9.14% is less than the absolute return (30%) for the investment period of 3 years. This is due to compounding effect on the amount of investment.
Trailing Return:
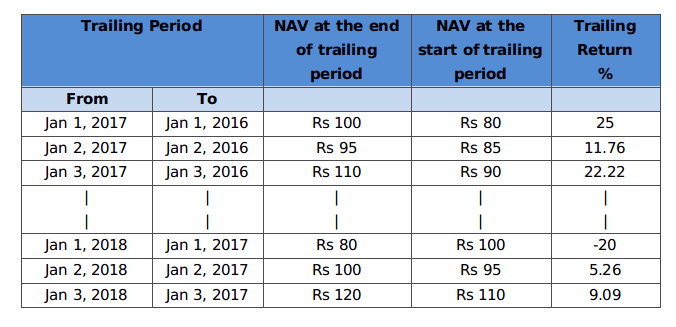
Trailing returns are principally the past returns of a fund or asset calculated from the current date to any date in the past. So, trailing is the process of looking back at a fund’s performance from any particular date. The trailing period can be a week or month or 1 year, 3 years, 5 years, 10 years, etc. All those mutual funds analyzing sites we land on show us the ‘Trailing Returns’ which are calculated with the help of the following formula (in excel):-
= (Today’s NAV / NAV at the start of the trailing period) ^ (1/Trailing Period) – 1
Trailing returns for the duration less than a year are termed as absolute while for more than a year they are calculated as annual returns. Let us grasp this with the help of an example. Suppose the NAV of a fund today (February 10, 2018) is Rs 100 but 3 years back (i.e., February 10, 2015), its NAV was Rs 60. The 3-years trailing return of the fund is 18.6% (See Table). As we can see, the trailing return for any point of time can be determined in the same manner.
Trailing returns is the most popular mutual performance measure. But it is influenced by the current market sentiments over the market situation prevailing at the start of the trailing period. Hence, these types of return are high in bull markets and low in bear markets.
Rolling Returns:
Rolling returns are the returns generated in a particular period rolled at regular intervals for a specific duration. Rolling returns can be determined on daily/weekly/monthly basis, till the last day of the specified duration. For example, you can take 1-year returns rolled every month for 3 years. This will tell you how 1-year returns have moved. Let us break down this example into three components for the ease of understanding.
- Rolling 1-year Returns : This is the duration for which the returns are considered.
- Rolled Monthly : This indicates the frequency with which we are looking at the returns. Rolling 1-year returns, rolled monthly means that we are considering the 1-year return each month. Returns can be rolled even on a weekly or daily basis.
- Over 3 years : It is the period of time over which the returns are rolled. Here we are looking at the 1-year return every month, for 3 years.
The mathematical calculations for rolling returns are same as that of trailing returns. But rolling returns give us a more realistic view. They are aimed to highlight the magnitude and frequency of an investment’s strong and weak performance periods. The charts of the rolling returns depict the profits of a scheme taken for a specified rolling period. For a given period, this approach assesses the actual behavior of the returns experienced by an investment in the forward direction. As a result, rolling returns are not skewed by the current market conditions and lend better insights of a fund’s return history.
Relative Return:
Relative return is a measure that compares the return earned by a stock or fund to its benchmark. It is the return earned by an asset over a period of time relative to a theoretical reference portfolio. Relative return is helpful in making investment decisions. Suppose you invest in a share and achieve a return of 20% over a period of time. But how would you figure out that this investment was a hit or a miss? To find that out, let us assume the Nifty index as benchmark which managed 15.58% over the same period. This indicates the stock in which you invested performed relatively good and generated +4.42% returns. In case the market falls and the stock appreciates the sentiment, then the fall less than the benchmark is considered to be better, as it manages to controls losses for the investor.
Conclusion:
We have gone through a few return types in this blog. Each of them has their own importance as well as drawback. As explained earlier, Trailing returns become bias across the timescales and even point to point returns are specific to the period in consideration. Therefore, both the aforementioned options may not be relevant in the present time. As far as rolling returns are concerned, they are globally accepted as the best tool to measure the fund’s absolute and relative performance without any bias. But in India, the case is not same. As we have seen in the antecedent illustrations that the returns tend to compound over the holding period. Thus, most analysts prefer using the compound annual growth rate (CAGR) approach to evaluate these changing returns.
With this blog post, we have tried explaining different terms associated with mutual fund returns. We hope this information might have imparted a brief understanding of distinctive types of returns, which would assist you to evaluate the performance of the schemes in your portfolio more effectively. Please stay tuned to MySIPonline as we bring some more financial terms regarding fund portfolios.


