Table of Contents
- Check the investment style of the scheme
- Match the objective of fund with your own.
- Access your risk taking capacity.
- Analyze the long term performance
- Analyze the track record of fund managers
HDFC Balanced Advantage Fund:
Introduction:
HDFC Balanced Advantage Fund – a versatile investment option designed to adapt to varying market conditions like bull and bear phase. The fund has delivered a strong sound track record, delivering consistent returns while effectively managing risk – making it an attractive choice for stability and growth seekers. As the fund adapts to market conditions, in bull markets it increases equity exposure, while during market corrections, it shifts to more conservative debt options. This flexibility is guided by the fund’s manager’s expertise.
The Proof is in the performance:
Performance analysis of the fund involves complete assessment of its historical returns, risk metrics and other relevant factors to know how well it has performed over a specific time period.
Now, the very first step under this process is –
Return Analysis:
Under the return analysis to get primary insights into how the fund has performed and its ability to deliver returns, rolling returns are calculated to assess the fund consistency and its comparison with peer group.
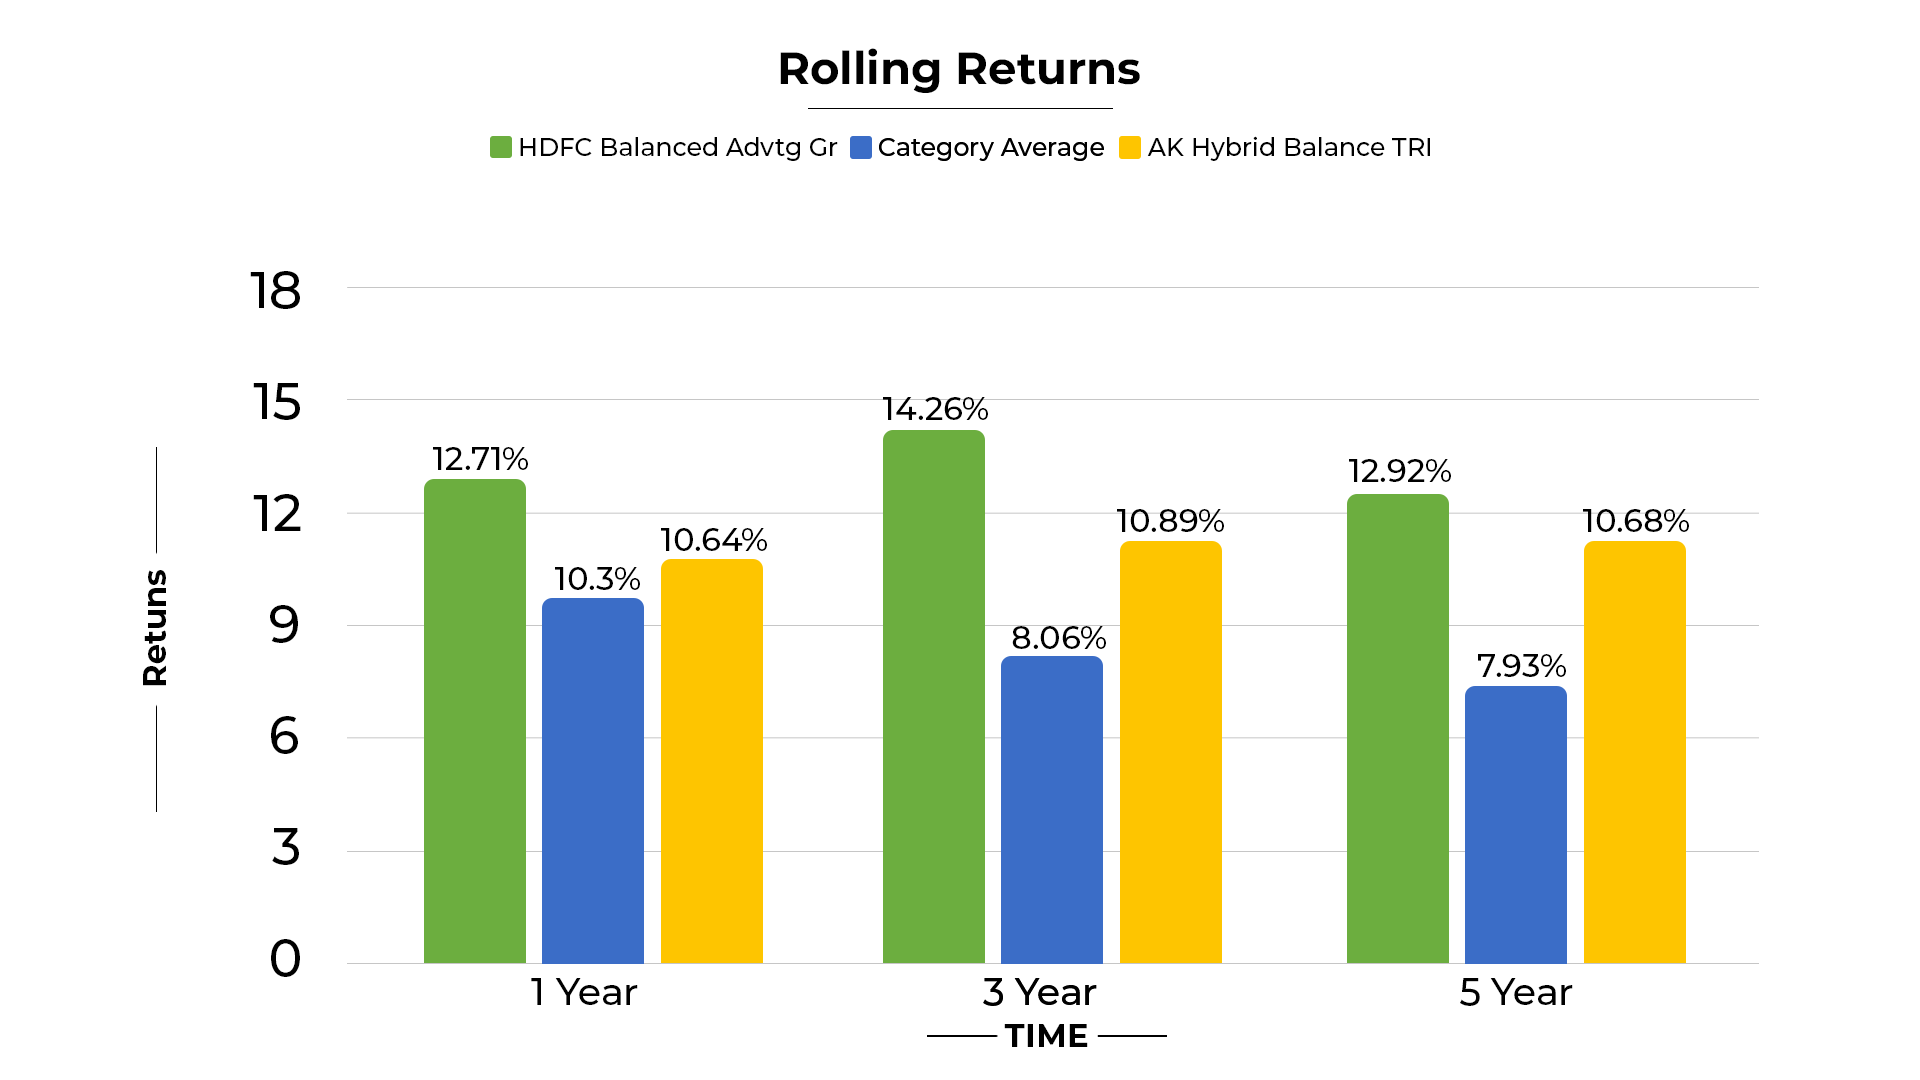
Now, take a moment to glance at the graph above, as we see it clearly depicts that first step is to collect data on the fund’s historical, which includes returns over different time frames i.e. (1 Year, 3 Years & 5 Years) and benchmark returns to compare the fund’s performance. So, the fund’s average 1,3 & 5 years rolling returns are 12.71, 14.26, and 12.92.
The numbers tell an interesting story: The fund has achieved average returns which aren’t just good, they are remarkable especially when you compare they are much higher than its category average and its benchmark.
This clearly shows that historically this fund has strong consistency in beating its benchmark returns, also its returns are very high.
Having assessed the fund’s historical consistency and benchmark outperformance, our next step involves an examination of fund’s current performance, this is done to check the current financial health of the fund.
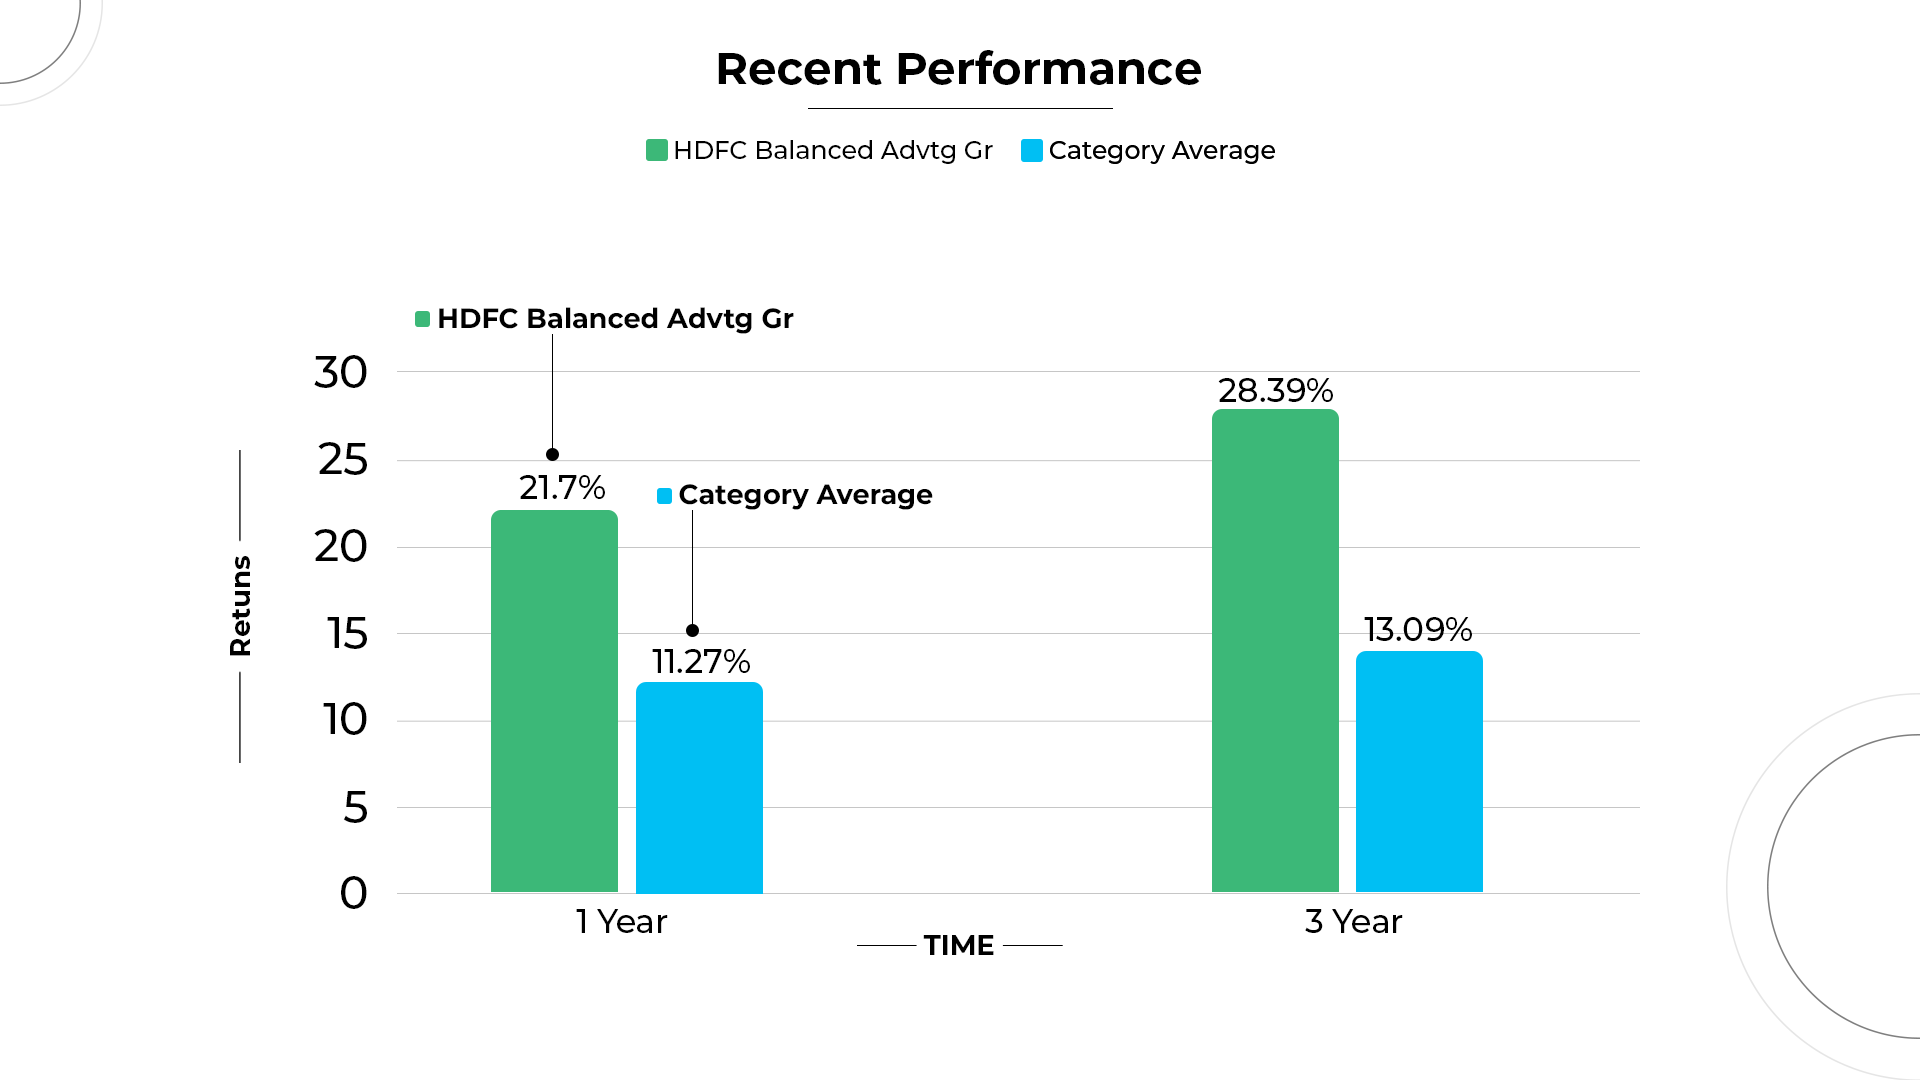
In just one year, while the Balanced Advantage Fund category average was 11.27, this fund went above and beyond, beating the benchmark with an incredible return of 21.7. But on hold, the excitement doesn’t stop there! When we stretch our view to 3 years, where the category average stood at 13.09, the fund didn’t just performed well, it did amazingly with a return of 28.39.
This fund keeps on doing better and gives fantastic performance. Now, let’s dive into how effectively it has handled the risk.
SIP Returns:
As SIP returns are the gains or losses from a systematic investment plan, where you invest a fixed amount regularly. These returns depend on market performance and how long you’ve been investing.
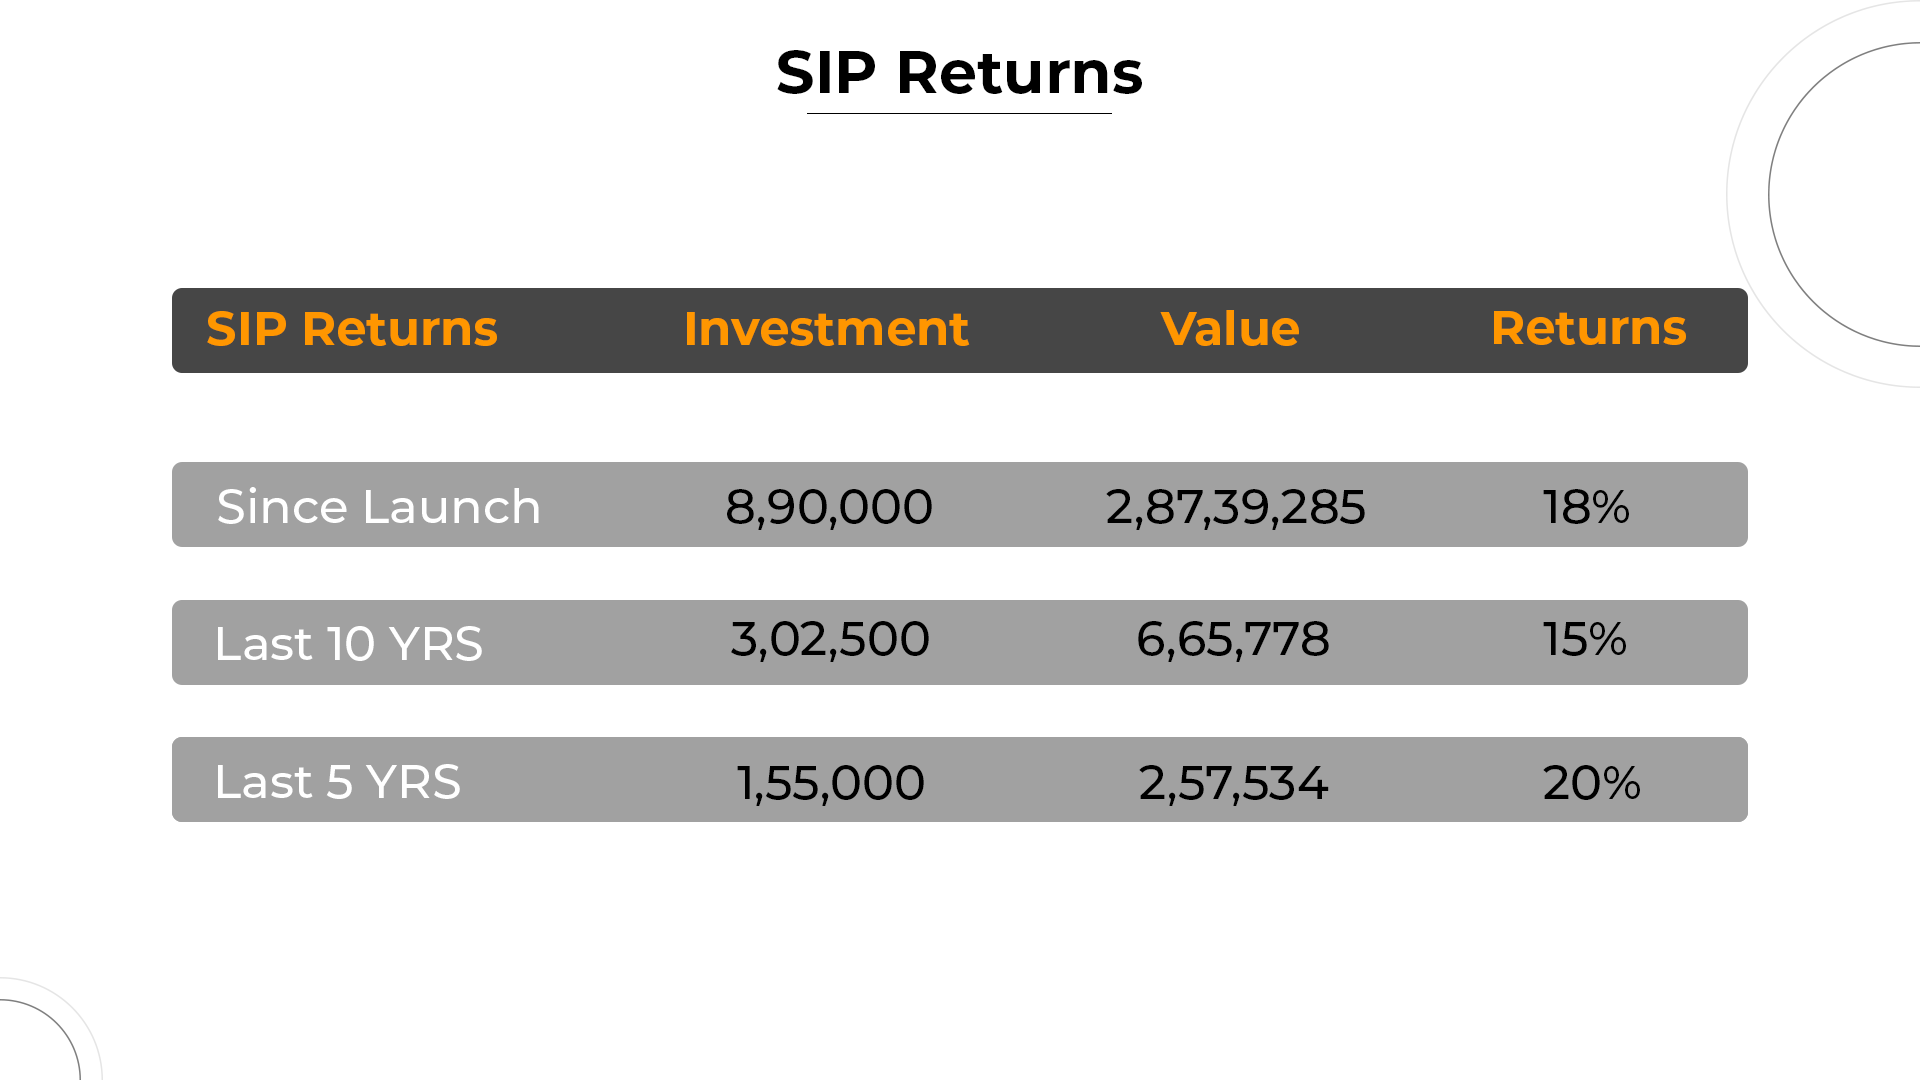
If you would have started a Online SIP of RS. 3000 in the HDFC Balanced Advantage fund since its launch until now, your total investment would have grown to RS. 8,90,000 and the accumulated wealth would be RS. 2,87,39,285. This translates to an impressive average annual returns of 18%, which is considered excellent for mutual fund returns.
Looking at shorter time frames, over the last 10 years, an investment of RS. 3,02,500 would have grown to RS. 6,65,778, generating a 15% return. In past 5 years, an investment of RS. 1,55,000 would have accumulated to RS.2,57534, delivering a remarkable 20% return.
These returns highlight the fund’s strong performance over different time periods, making it an attractive choice for investors seeking good returns for their investments.
Risk Analysis:
(Risk Management = Protecting your capital) this means fund’s primary objective is capital preservation during market downturns by reducing exposure to riskier assets when the signals turn bearish.
The risk-aware approach aims to safeguard your wealth while allowing you to participate in market upswings.
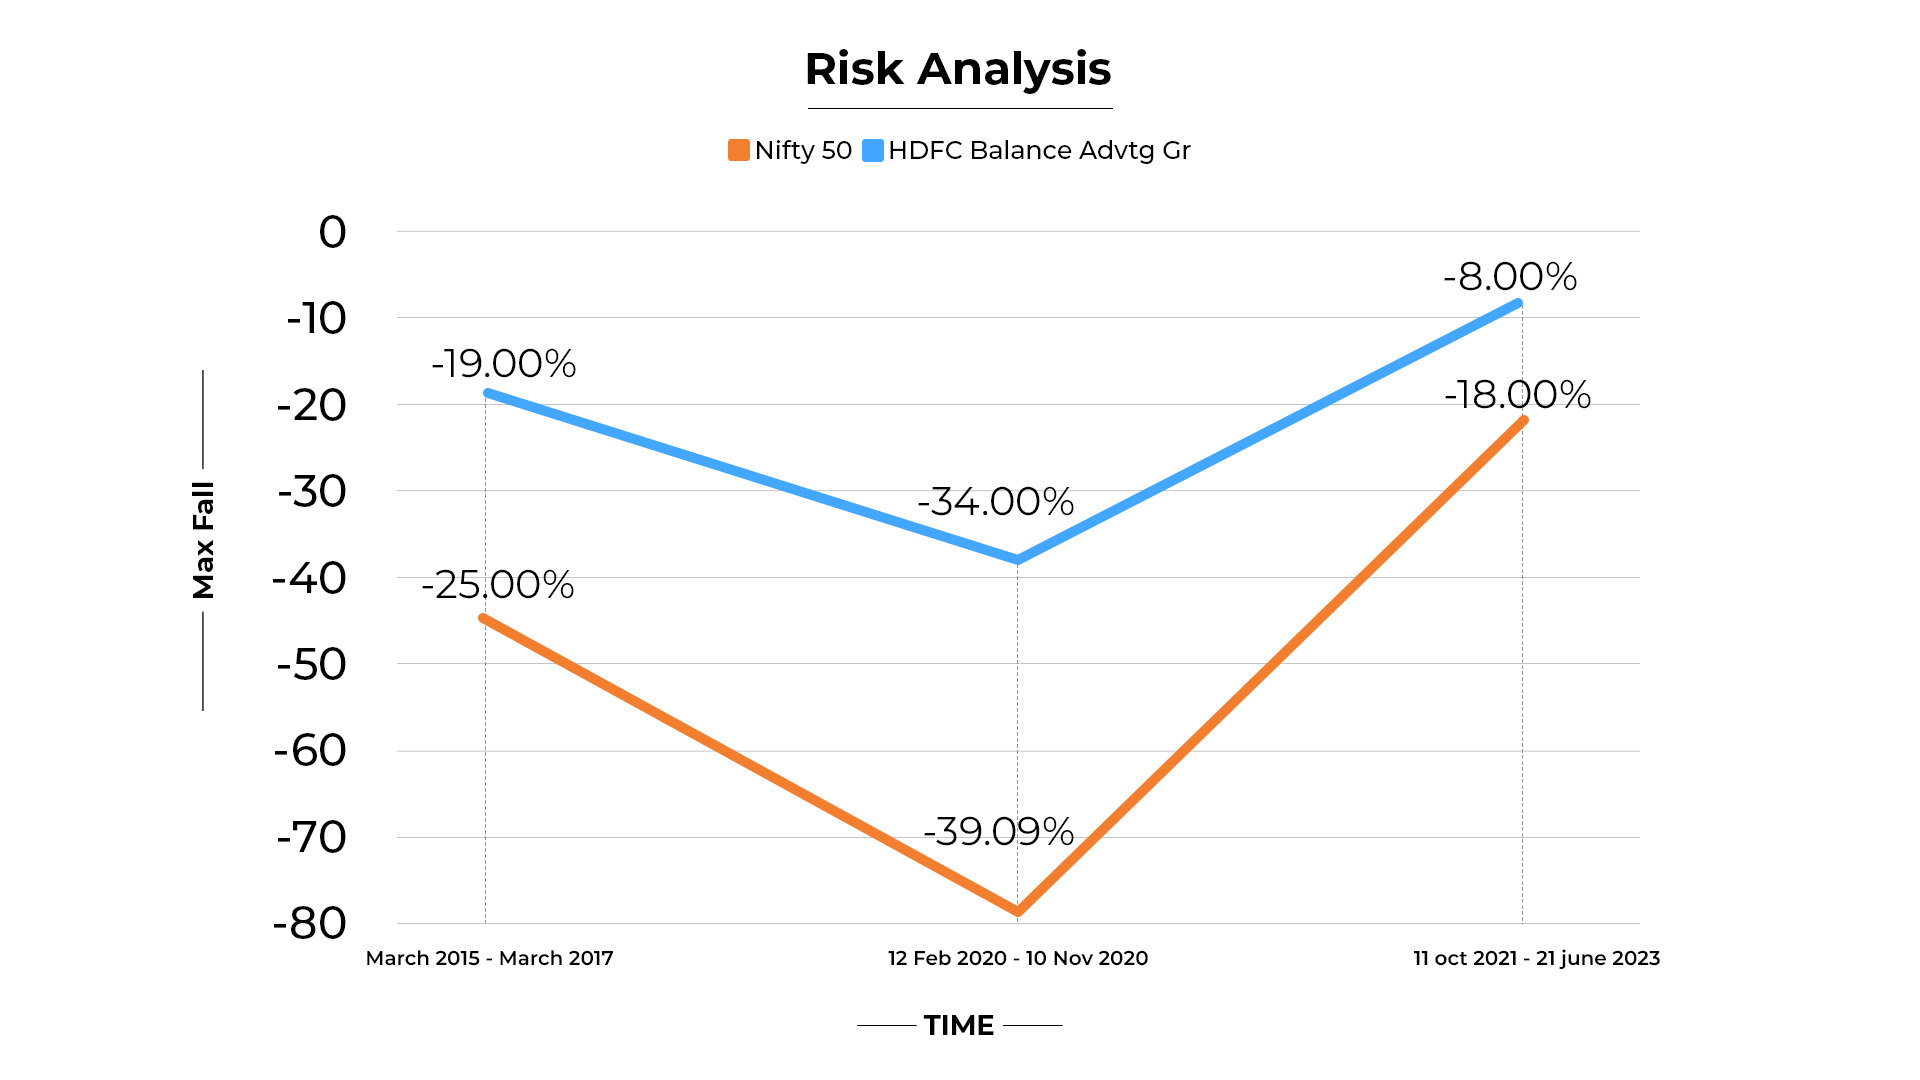
Let’s take a moment to examine the graph to see how well HDFC Balance Advantage Growth handles risk. We have taken 3 big falls in the market to understand how the fund managed its fall. So let’s have a look:
Phase 1. (MARCH 2015 – MARCH 2017)
Here in first phase Nifty 50 (a stock market index) experienced a maximum decline of (25.00%) while HDFC Balance advantage fund growth has smaller decline of (-19.00%) which describes that fund showed rapid improvement that closely matched its benchmark.
Phase 2. (12 Feb 2020 – 10 Nov 2020)
In second phase Max Fall by Nifty 50 had a substantial fall of (-39.09%) while HDFC Balance Advantage Growth experienced somewhat milder decline of (-34.00%). However, it took the fund longer to recover due to the pandemic induced market crash, resulting in a delayed recovery.
Phase 3. (18 Oct 2021 -27 July 2022)
In third Phase Max fall by Nifty 50 saw a maximum decline of (-18.00%) and HDFC Balance Advantage Growth had a smaller decline of (-8.00%) again in third phase it recovered very fast compared to its benchmark. This remarkable ability of fund to recover quickly indicates that fund is managed properly and have good risk tolerance ability.
Apart from it another way to analyze the risk is by checking its daily volatility. So as to check the daily volatility we check the standard deviation. If any fund has high standard deviation which shows fund is highly volatile.
Standard Deviation of HDFC Balanced Advantage Growth is (13.71) which is comparatively higher than its benchmark which is (12.35) which is why the fund is considered to be highly volatile.
Considering volatility alone doesn’t give an accurate picture of overall risk.
Highly volatile funds can also yield significant returns when markets are doing well. Therefore, it’s advisable to assess their risk-to-reward ratio, which is determined by Sortino Ratio.
So it’s Sortino ratio is 3.89 which is higher as compared to its benchmark which indicates better performance relative to the downside risk, signaling a stronger risk-adjusted returns.
Investing Strategy:
The primary strategy of this fund is to manage investments in both stocks (Equity) and bonds (Debt) dynamically. The fund manager makes these decisions based on a key indicator known as the corporate earnings yield compared to government securities.
Here’s how it works: When the corporate earnings yield is high, it suggests that the stock market is doing well (Bull Market). In such times, the fund manager increases the allocation of the fund’s money to stock. This move aims to capitalize on the potential for strong returns in the stock market, thereby growing wealth for investors.
However, when government securities’ yields start to rise and the earnings yield from stocks drops, it’s an indication of changing market conditions. In response, the fund manager shifts more of the fund’s assets into bonds or debt instruments. This strategic move helps protect the fund’s asset during stock market downturns and generate income from the fixed income investment.
This balanced approach aims to provide the best risk-adjusted returns.
In equity segment, the fund invests in companies of all sizes, with a focus on those experiencing strong revenue growth due to business expansion.
In debt segment, the fund usually in high-quality bonds to manage risk effectively. However, it may make slight credit and duration adjustments for opportunities.
Now that we’ve explored the investment strategy, let’s shift our focus to portfolio allocation.
Portfolio Allocation: The heart of the strategy
Portfolio allocation means dividing investments (stocks, bonds, cash) to meet financial goals while managing risk.
Equity Allocations:
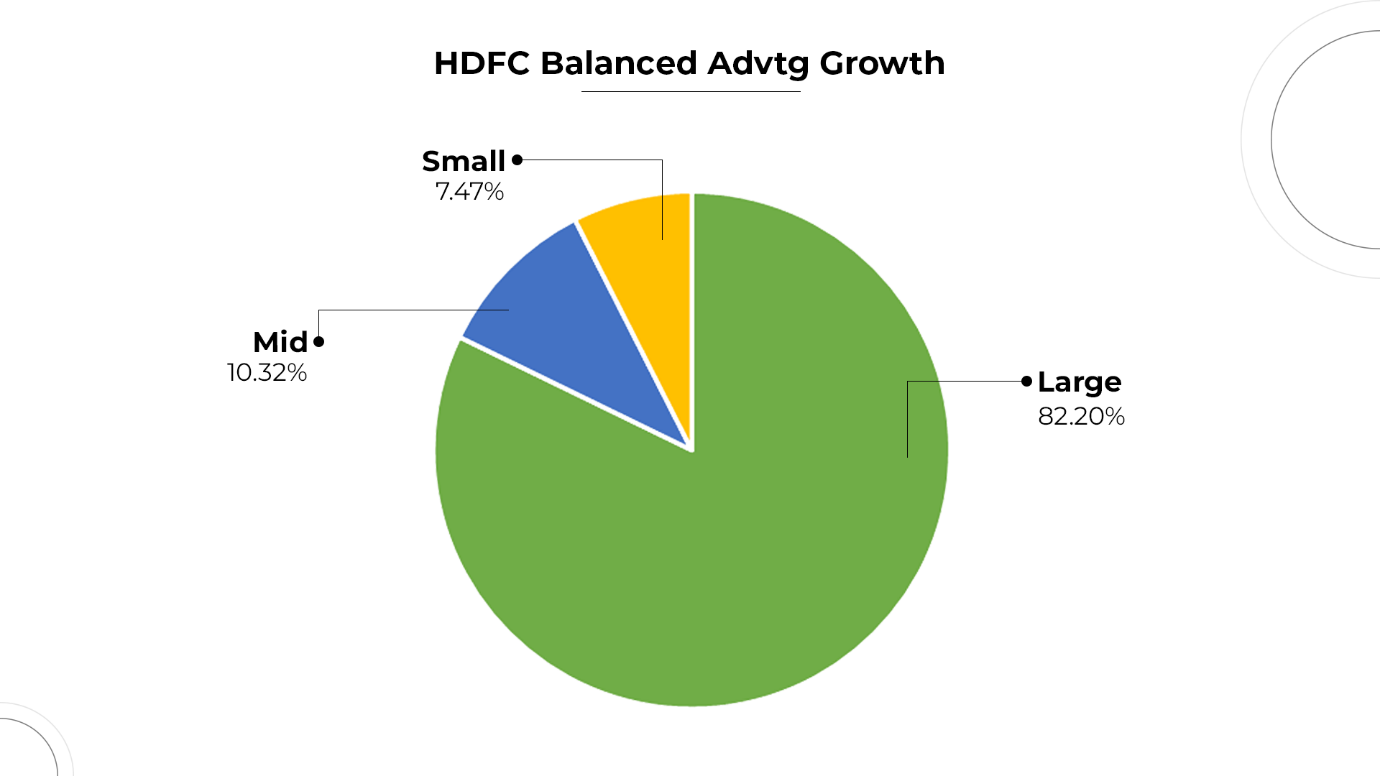
By considering the above pie chart which depicts the market cap allocation of the fund at online SIP.
Market Cap Allocation:
The fund has invested total of Equity (58.97%) into which 82.20% is invested in large cap, 10.32% is invested in Midcap, and 7.47% in small cap.
This means fund has reduced its equity allocation as market is at its top. Also equity money is conservatively invested in large cap stocks.
Now we have seen the Equity Market Cap allocation we will see the sector wise allocation of the fund.
Sector Allocation
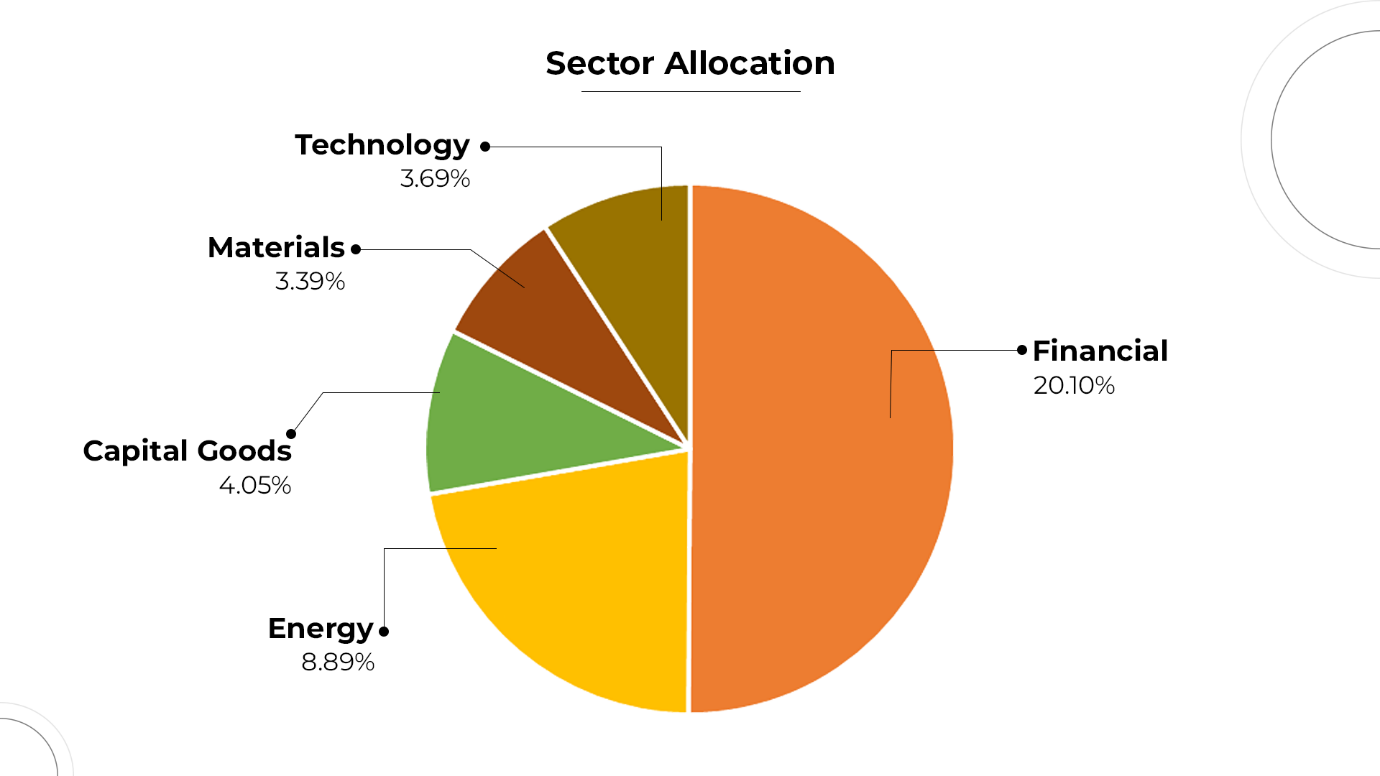
Funds top 5 sectors where it has invested its majority of money are:
- Financial – 20.10%
- Energy – 8.89%
- Capital Goods – 4.05%
- Materials – 3.39%
- Technology – 3.69%
Debt Allocation:
Followed by this it has invested total 27.78% in Debt fund into which it has invested around it 48.56% in Government Bonds and 20.24% corporate Bonds. The modified duration for these funds is 2.55, Effective Maturity is 5.33, and weighted coupon 7.33, as the funds has relatively low modified duration means the fund are less affected by changes in interest rates. This shows its debt portion is also safe and conservatively managed.
And total of 1.61% in Real Estate and 11.63% in cash.
Now let’s have a look on some basic details of the fund:
- NAV (Net Asset Value) – The NAV of the HDFC Balanced Advantage fund as of September 22, 2023 is Rs. 381.11.
- AUM (Asset Under Management) – The fund has Rs. 61599 Crores worth of AUM as on 30 June, 2023 and is medium sized fund of its category.
- Expense Ratio – The fund has an expense ratio of 1.46%, which is higher as compared to other funds.
- Minimum Investment:
Minimum SIP Amount is Rs. 500 and Lump sum is Rs. 5000.
- Fund Manager:
Gopal Agarwal: 20 years’ experience, including 2.5 in equity research. Now managing since July 29, 2022.
Anil Bamboli: 28 years of experience, specializing in fund management, research, and fixed income dealing. Managing since July 29, 2022. He is recently handling the Debt segment of the fund.
Conclusion:
The fund’s impressive long-term track record and smart risk management have established it as one of the largest and most successful mutual funds in its category. Recognizing the current overvaluation in the market, the fund has skillfully adjusted its allocation between equities and debt instruments. Consequently, it remains an attractive option for new investments.
Read More : Is Mirae Asset Emerging Bluechip Fund Good? Fund Review 2023


.webp&w=3840&q=75)


